Area
We've found choosing the area for your custom print is a balancing act - covering a large area to capture recognisable natural features vs. honing in on a smaller area to produce greater detail and definition.
Elevation plays a key part in choosing how much area to cover. Areas with greater elevation range allow us to zoom out without flattening the print too much.
Typically we calculate a percentage for height vs. the longest edge of the print as a gauge of how prominent the features might be. For instance, the Atene skyline layout below has a range of 494 metres (highest point - lowest) and is 7 km each edge, giving a height percentage of 7%. This is about average for the prints we've scoped out to date.
Once you've settled on an area for your print we'll generate a render of what it would look like in 3D, then we can move on to selecting a size for it.

Layout Area for Atene Skyline, 7 x 7 km. We try to scope all of our prints on the Topo50 or Topo250 maps, as the gridlines provide a great reference.
Data Source: NZ Topo50 Maps | Author: Toitū Te Whenua Land Information New Zealand (LINZ) | Source: https://data.linz.govt.nz/layer/50767-nz-topo50-maps/ | License: Creative Commons Attribution 4.0 International License (CC BY 4.0)
Size and Scale
We'll take into consideration your budget and the space you'd like the print to fit into and provide a quote on 2 - 3 options. For each size we'll also indicate the prominence of the features in millimeters from the lowest point on the print.
Currently our printer can go up to 630 mm wide x 500 mm high. This means we can go quite large for landscape prints but portrait and square prints are limited by height.
A larger printer is in the works - we're aiming for at least 800 mm x 800 mm so watch this space!
When your quote comes through, you'll see your sizes expressed as a scale eg 1:20,000 (this means 1 m of your print is equivalent to 20,000 m (20 km) in actual distance). The scale is a useful reference as it helps define what data would be best to use...
Data
There are 3 types of data we might be able to utilise for your print - LiDAR DEM, LiDAR DSM and Satellite DEM.
LiDAR (Light Detection and Ranging) is gathered by flying a plane or drone over an area with a specialised scanner. It can capture much more detail than satellite but is only available in select areas. Thanks to the awesome folks at Land Information New Zealand (LINZ), we have excellent coverage in NZ, with 80% of the country scanned and more data being added all the time. LiDAR data comes in two varieties - DEM (Digital Elevation Model) and DSM (Digital Surface Model).
1. LiDAR DEM - The Digital Elevation Model shows the base elevation of a landscape, with all buildings and trees cleared off the model. This can allow us to see walking tracks at certain scales, and gives a clear definition to topographical features. We can use this data for prints between 1:2,000 and 1:50,000 scale.
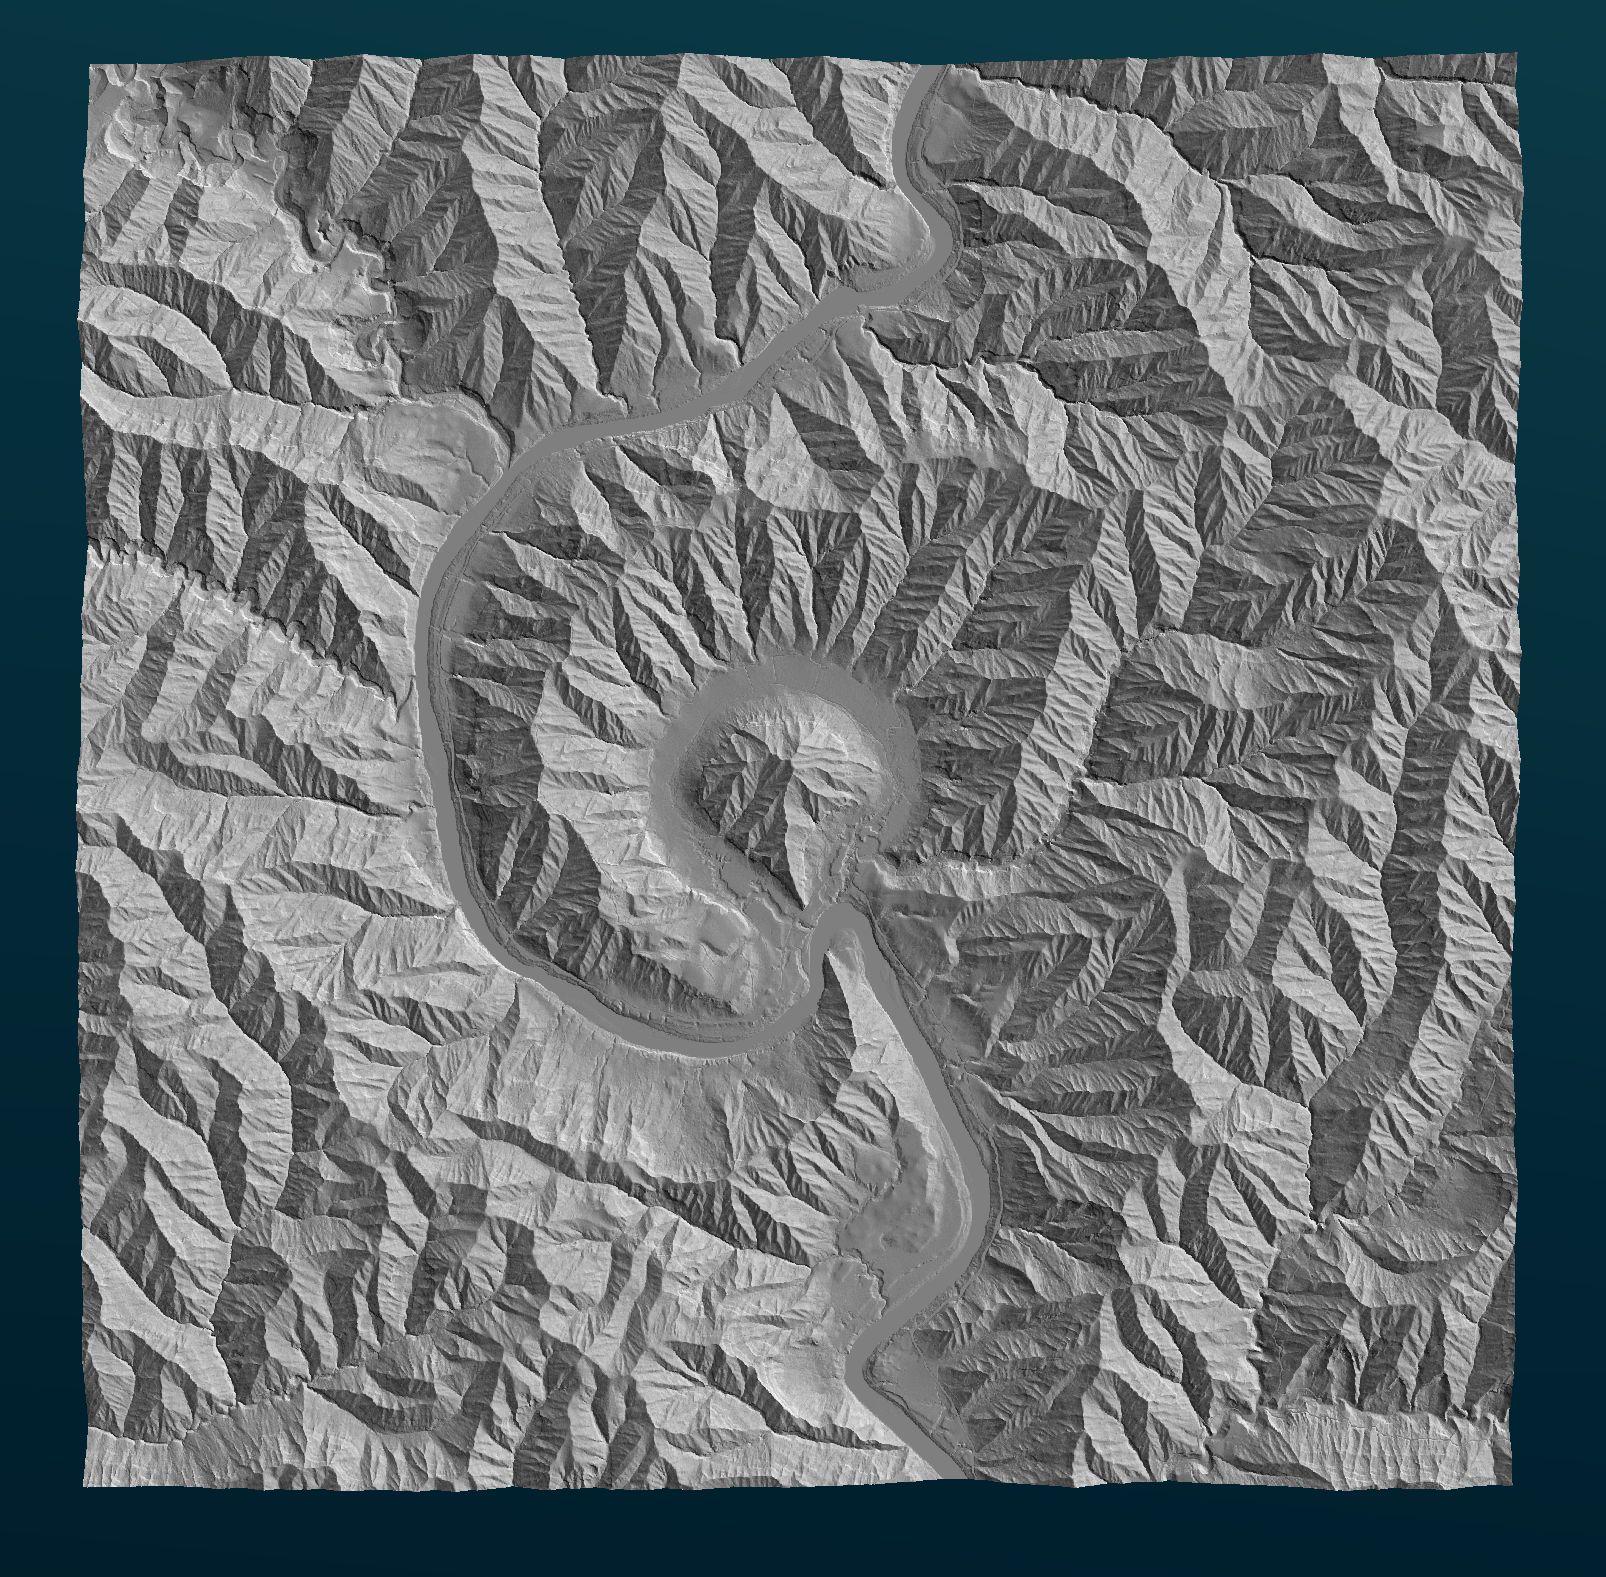
Here's a render of Atene Skyline generated with LiDAR DEM, with excellent definition on the ridges and valleys. In the image below you can see the faint detail of the Atene Skyline Track as it follows up and around the ridgeline.
Data Source: New Zealand LiDAR 1m DEM | Author: Toitū Te Whenua Land Information New Zealand (LINZ) | Source: https://data.linz.govt.nz/layer/121859-new-zealand-lidar-1m-dem/ | License: Creative Commons Attribution 4.0 International License (CC BY 4.0)
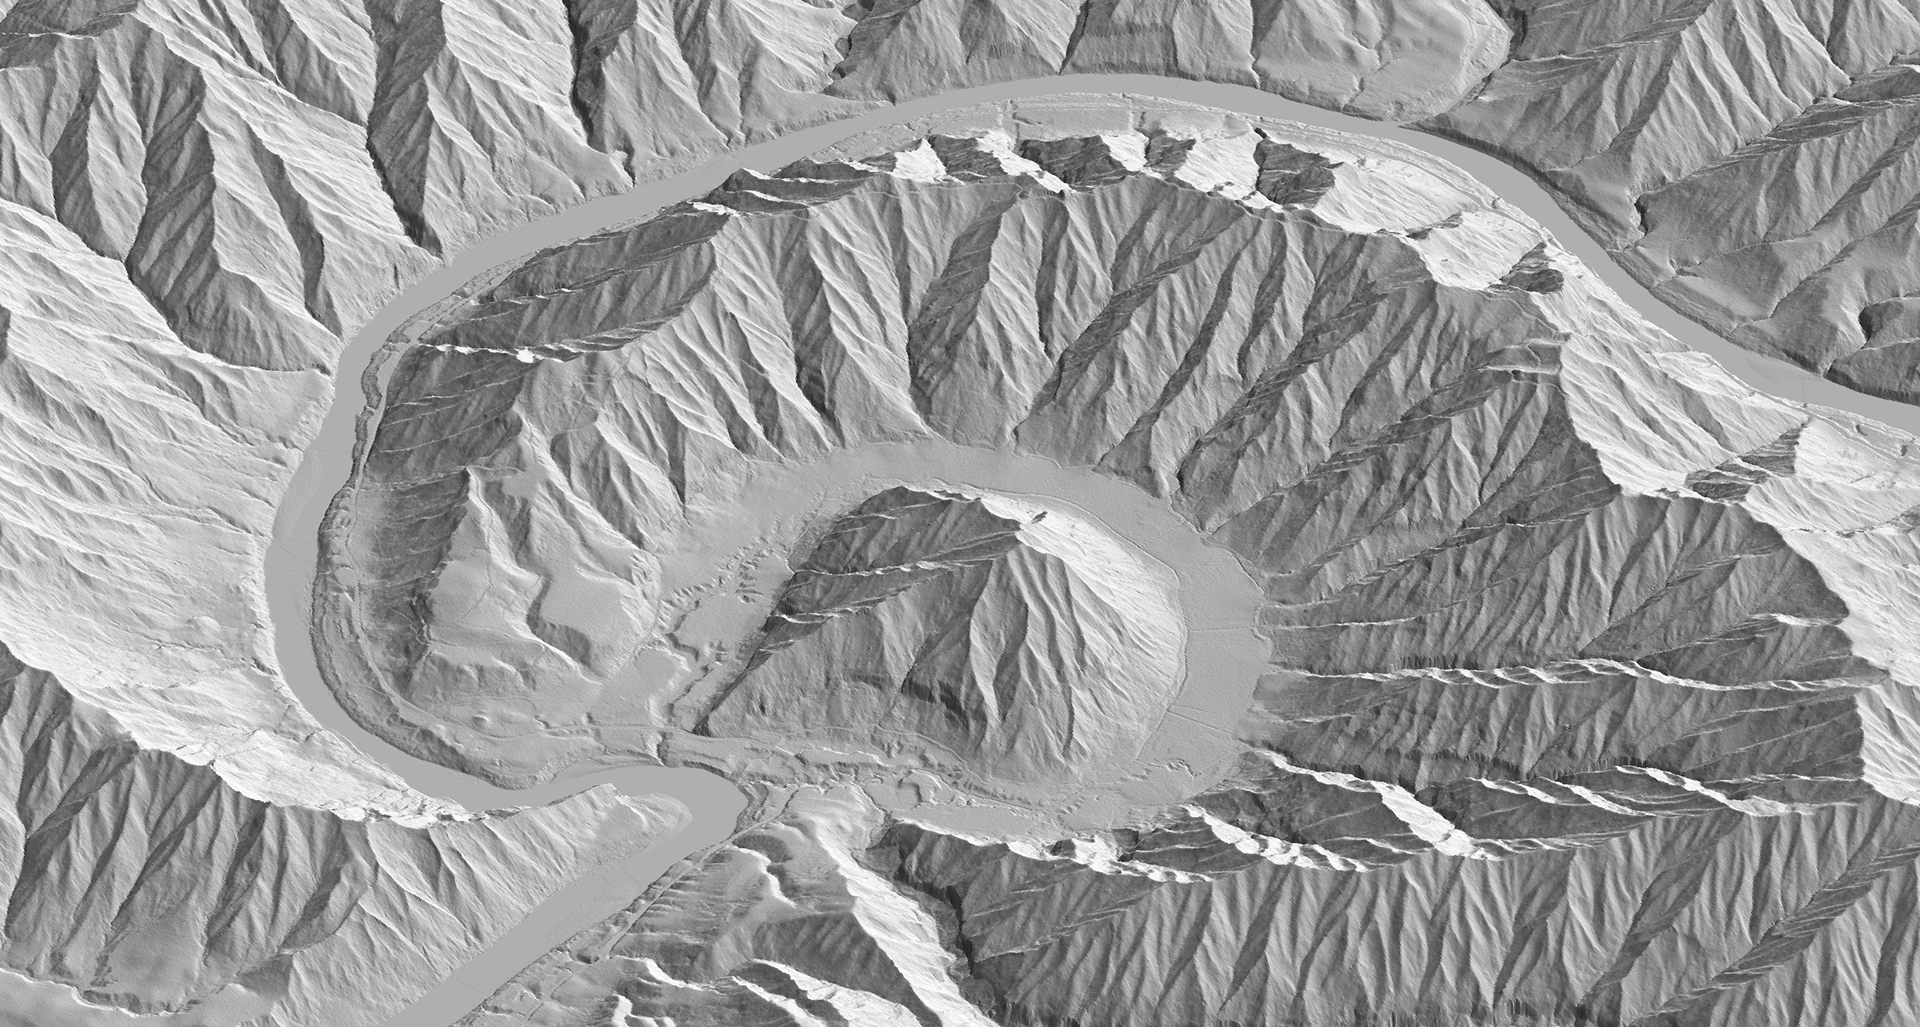
2. LiDAR DSM - The Digital Surface Model shows all of the detail captured in the scans, including buildings, bridges, trees and crops. The scales we can print to with DSM are a little more restrictive - we can't zoom in too far if there are any large buildings in the print as the vertical edges don't come out well on our printer. We also limit how far we zoom out to, as the features for DSM tend to disappear past 1:30,000. Some walking tracks through dense bush might be a little harder to follow in comparison to the DEM of the same area.
The sweet spot for DSM seems to be between 1:3,000 and 1:20,000.
Atene Skyline generated with LiDAR DSM, ridgelines and walking tracks might be obscured by the bush coverage.
Data Source: Manawatū-Whanganui - Whanganui River Catchment LiDAR 1m DSM (2025) | Author: Toitū Te Whenua Land Information New Zealand (LINZ) | Source: https://data.linz.govt.nz/layer/122649-manawatu-whanganui-whanganui-river-catchment-lidar-1m-dsm-2025/ | License: Creative Commons Attribution 4.0 International License (CC BY 4.0)
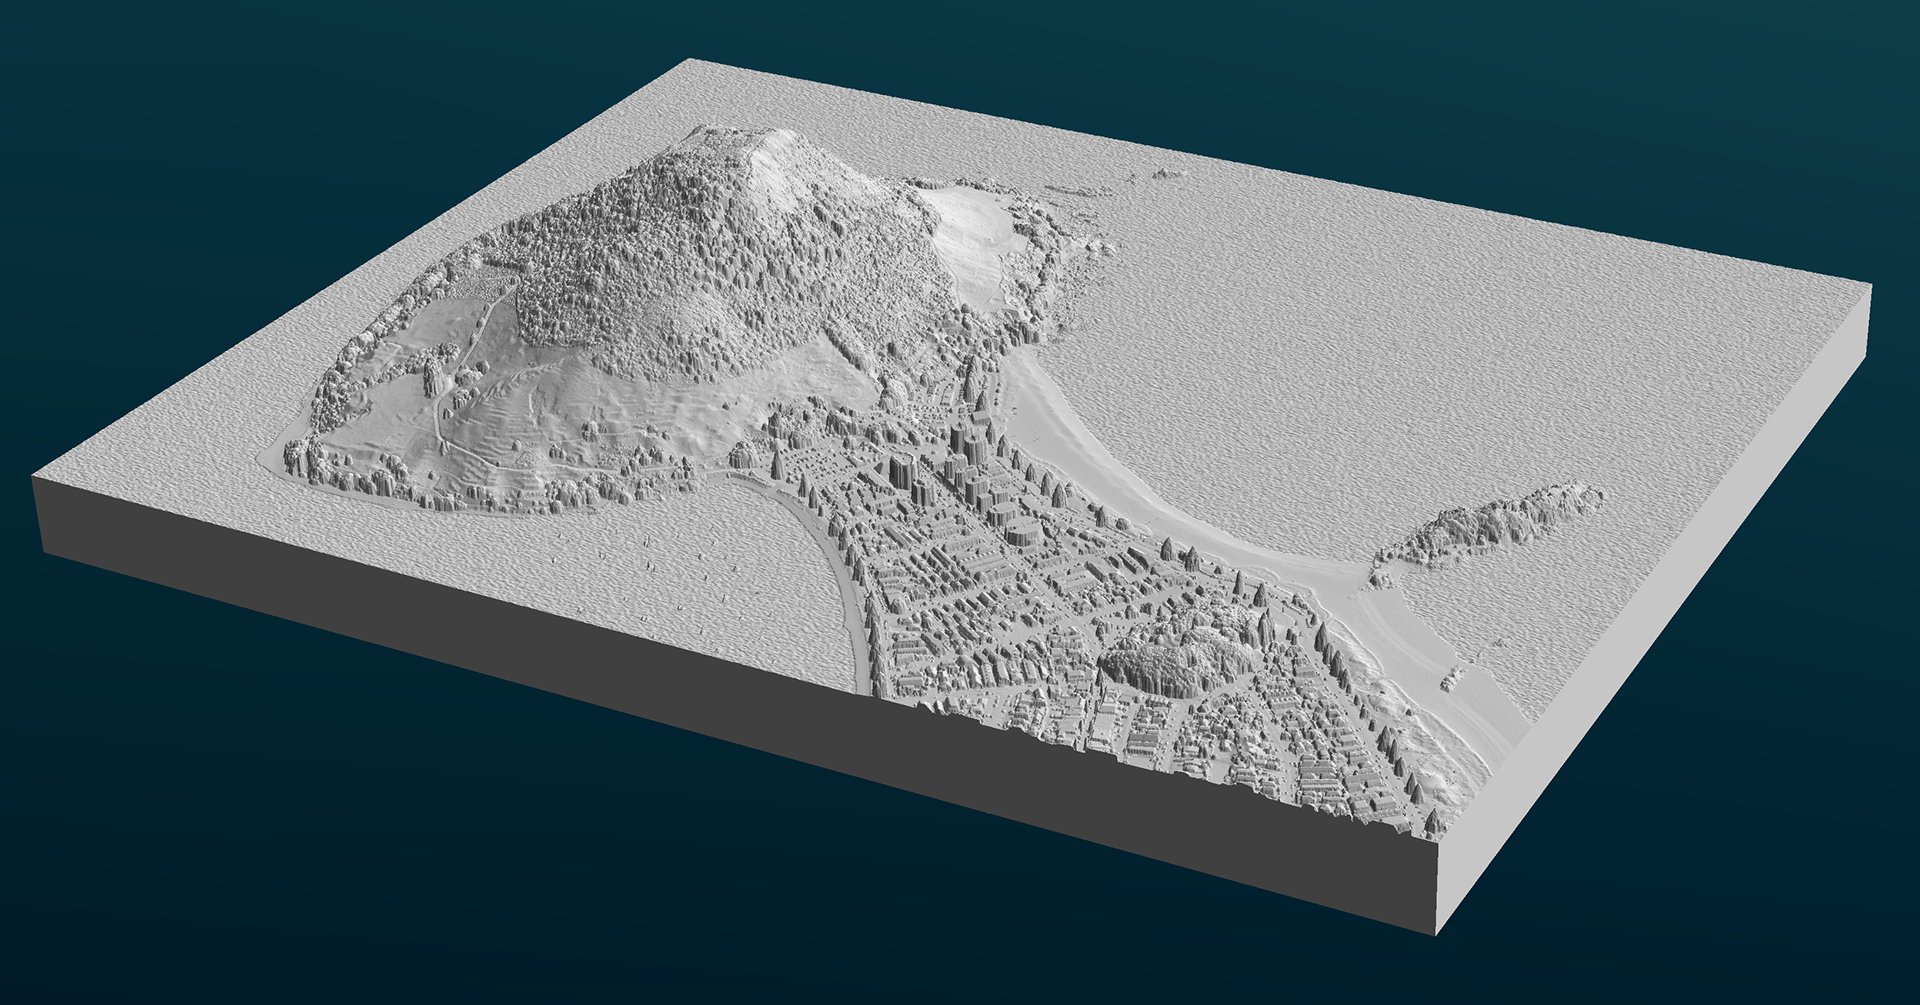
Mount Maunganui with LiDAR DSM. The scan even captures boats moored in Pilot Bay.
Data Source: Bay of Plenty LiDAR 1m DSM (2024) | Author: Toitū Te Whenua Land Information New Zealand (LINZ) | Source: https://data.linz.govt.nz/layer/120367-bay-of-plenty-lidar-1m-dsm-2024/| License: Creative Commons Attribution 4.0 International License (CC BY 4.0)
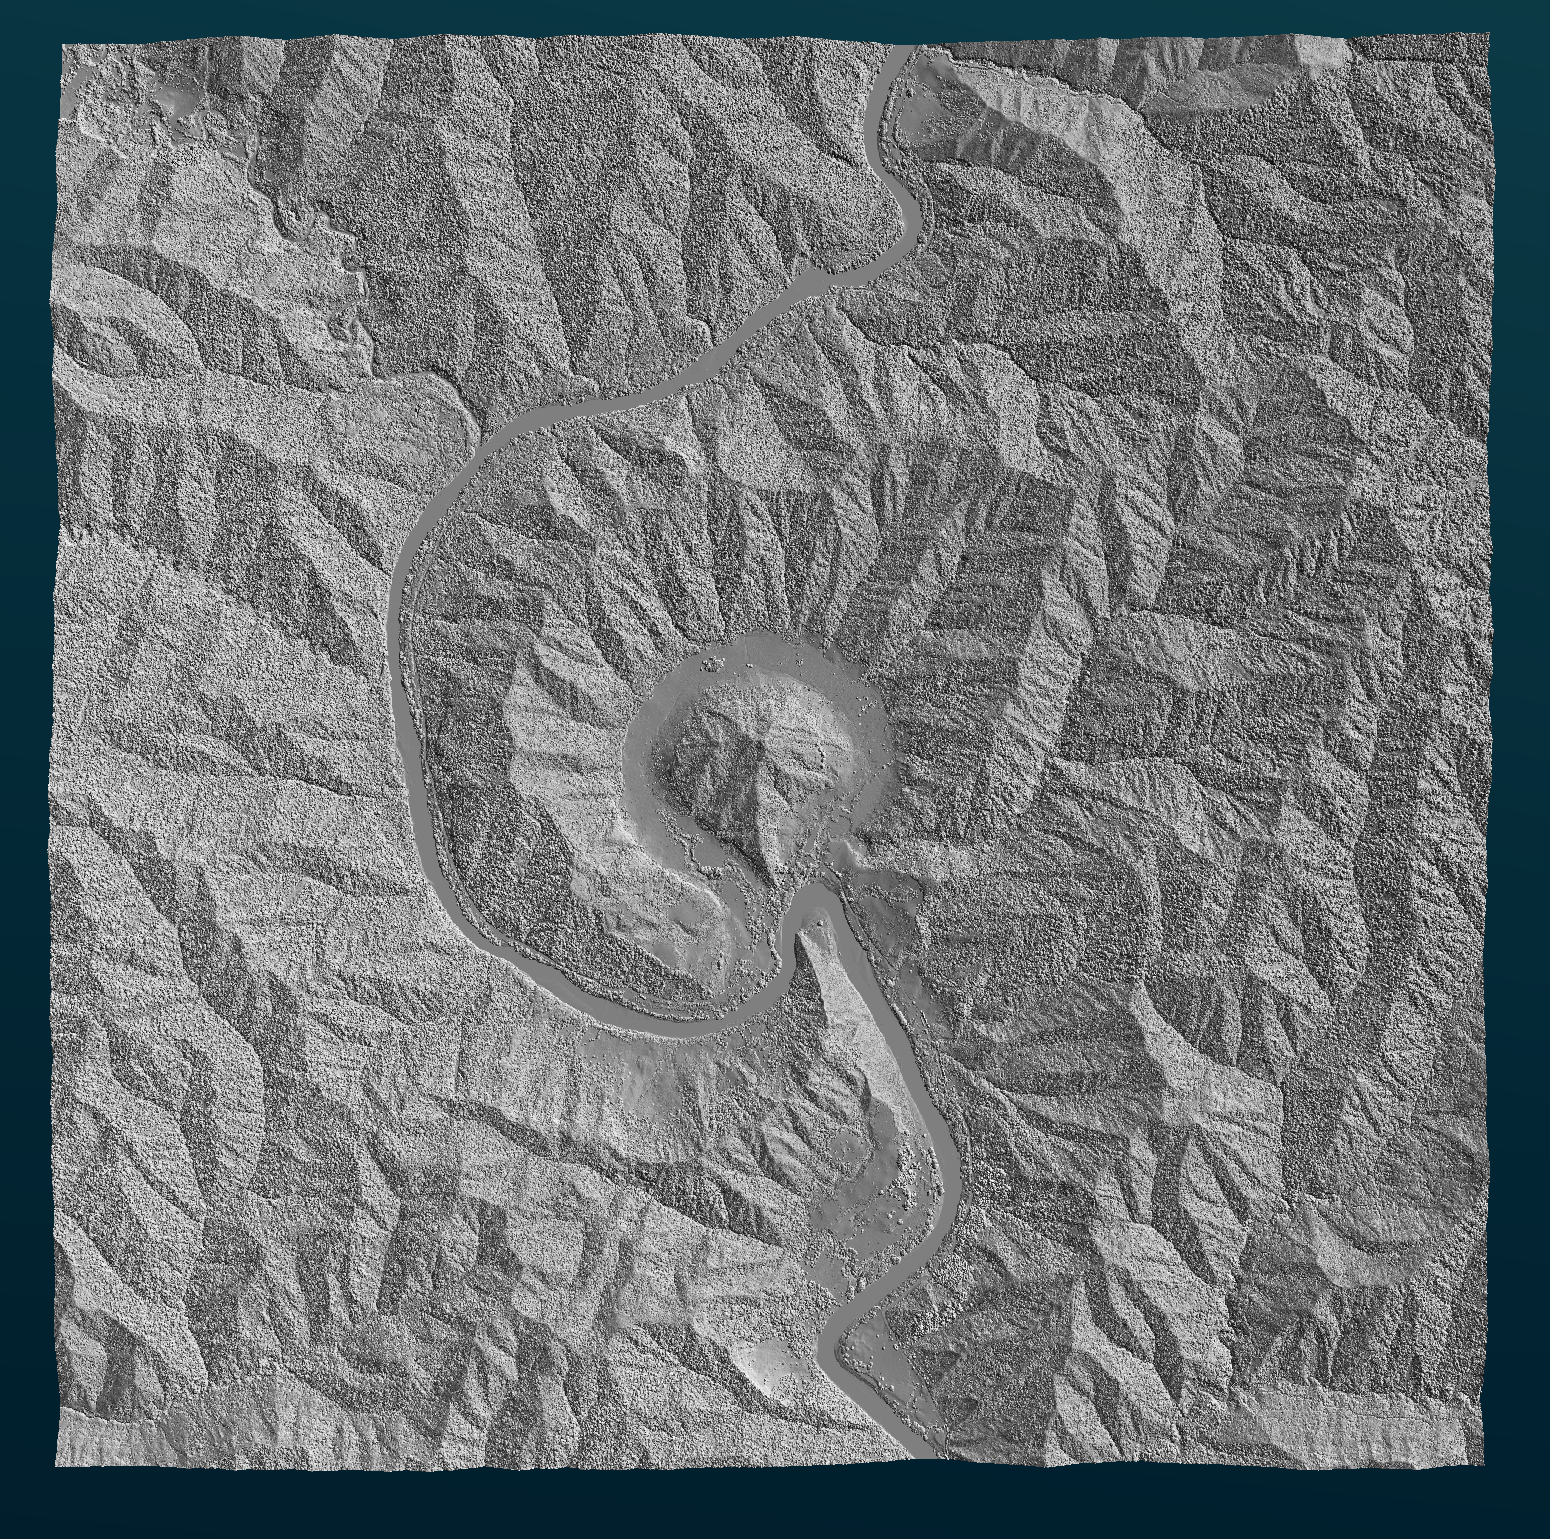
3. Satellite DEM - We can get satellite data covering the entire planet in various degrees of detail and accuracy but generally quite coarse in comparison to LiDAR. This means that while it will capture large geographical features, finer details and man made structures do not show up.
At closer scales satellite data will produce quite a bland, smooth print. However we can process the file to add a little texture and accentuate rivers and lakes etc. Generally we'll only use satellite if there's no LiDAR available for an area or if we've zoomed out past 1:50,000.
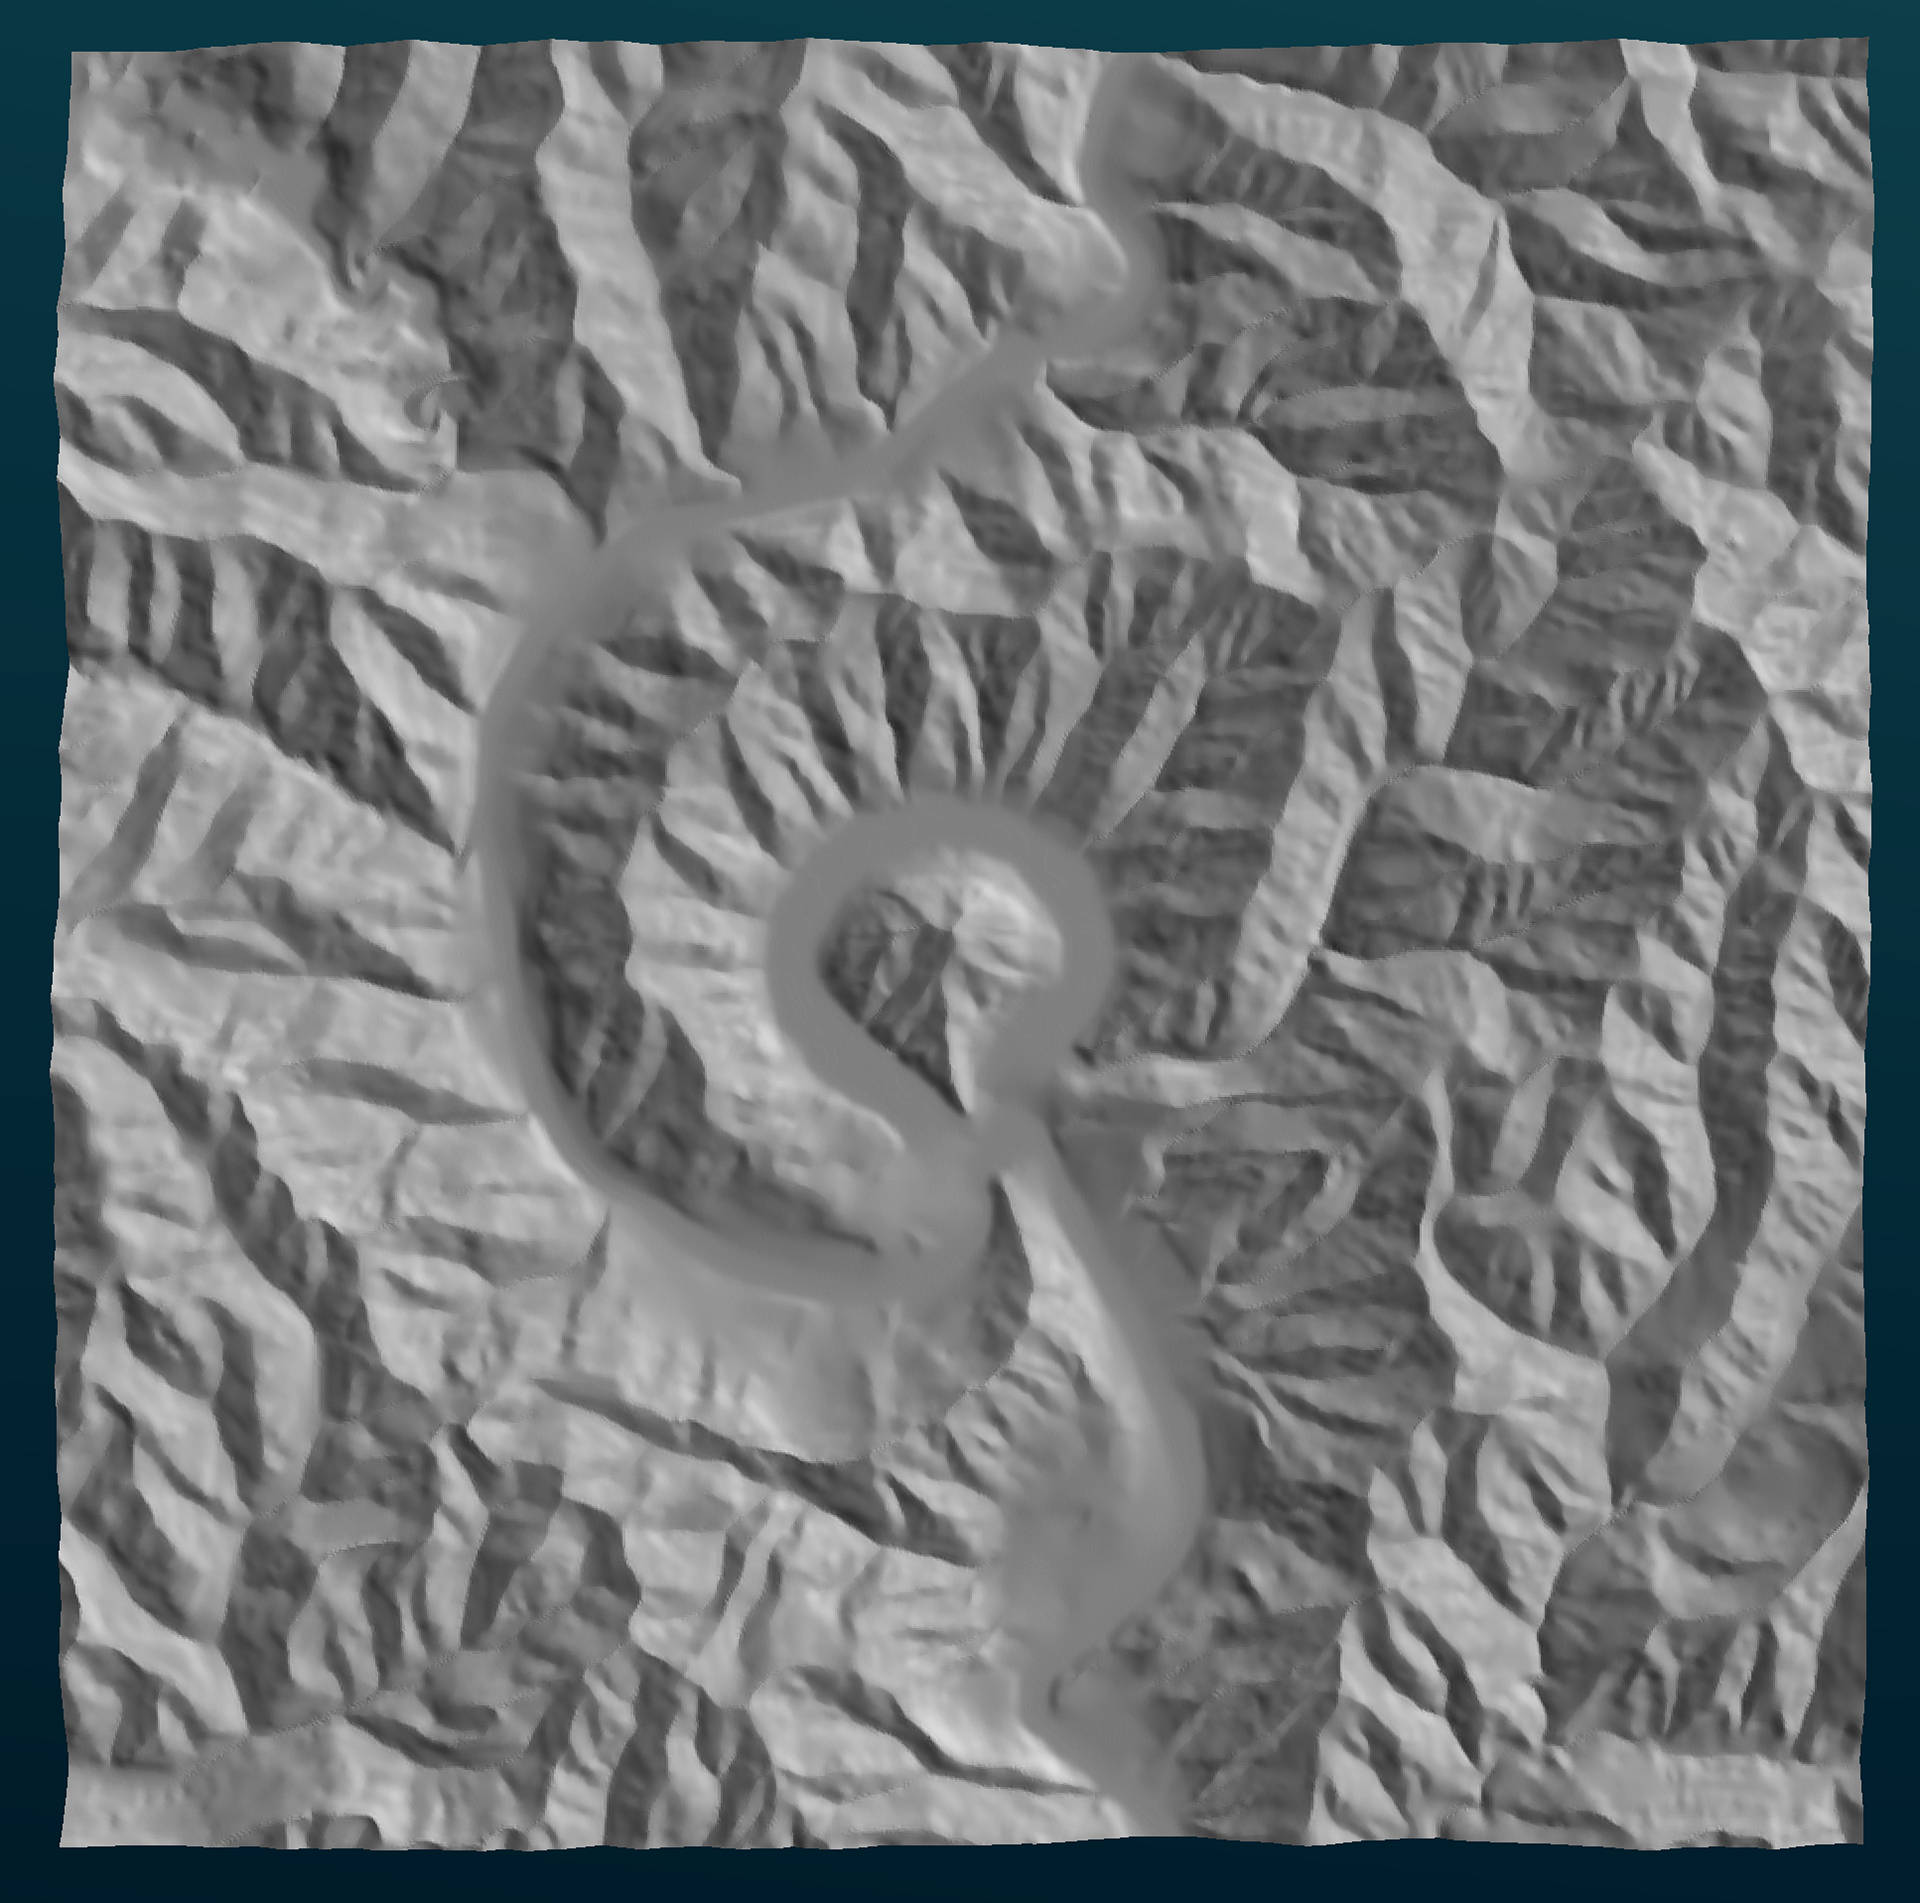
Atene Skyline with Satellite DEM, this would still be a passable print if there was no other data available, but it has a lot less detail than the LiDAR versions.
Data Source: NZ 8m Digital Elevation Model (2012) | Author: Toitū Te Whenua Land Information New Zealand (LINZ) | Source: https://data.linz.govt.nz/layer/51768-nz-8m-digital-elevation-model-2012/ | License: Creative Commons Attribution 4.0 International License (CC BY 4.0)
Water Texture
For lakes and coastal prints we add a slight rippled texture to the water surface to help differentiate it from the land and add a bit of character. On some prints we can even add in the prevalent swell for the beach.
Extra Details
In addition to the base print we can also add extra detail such as etching tracks, pin markers and seafloor elevation (depending on data availability). We're working on a method to paint on tracks for more visibility.
If you've got a special request please get in touch.